
Most risk teams do not suffer from a lack of data but from too much of it, scattered across spreadsheets, scanners and reports that nobody can cross-reference in time. An AI risk analytics platform tackles that problem by bringing assets, threats, controls and compliance into a common base and turning that volume into priorities someone can defend. This article shows how this kind of platform correlates data, anticipates exposure, gets information to the board and how to choose the right tool.
The starting point is concrete. Queried on 3 November 2026, the API of NIST's National Vulnerability Database (NVD) lists 72,798 CVEs published between January and September 2026, not counting rejected ones. The same period of 2025 had 35,366, and the whole of 2025 around 48,000 (NIST, NVD CVE API 2.0). In nine months, 2026 has already overtaken the entire previous year. No analyst can triage that volume by hand. The question is no longer how to collect data but what to do with it.
How AI analytics platforms transform risk data
An AI risk analytics platform turns raw data into actionable priorities by normalising different sources and applying business context to each exposure. The gain shows up when the cost of getting prioritisation wrong is high. In the 2026 edition of the Cost of a Data Breach report, by IBM with the Ponemon Institute, the global average cost of a data breach reached US$4.99 million, up 12% on the previous year and a record for the series. The same study puts at US$1.93 million the savings of organisations that make extensive use of AI and automation in security, compared with those that use none (IBM, Cost of a Data Breach Report 2026). Deciding well where to act first has measurable value.
The obstacle is the disconnect between sources. The asset inventory lives in one file, vulnerability results in another, compliance controls in a third, and nobody can confidently answer a simple question: which exposure threatens the most critical business process right now?
An analytics platform centralises these sources and applies AI to the consolidated base. In practice, that means:
- Asset, threat, control and supplier data in the same model.
- Deduplication and normalisation of sources, with less manual reconciliation.
- A single control inventory reused across frameworks and obligations, such as ISO/IEC 27001, SOC 2, NIST CSF and Brazil's LGPD (General Data Protection Law), to the extent that their requirements overlap.
In Futture's Eagle, this logic sits in the GRC module: a control mapped once can be reused across frameworks, traceable to each requirement. That is what cuts the rework of answering the same control several times for different standards.
Continuous correlation of assets, threats and controls
Correlation links each vulnerability to the asset it affects, to the control that should mitigate it and to the business process that depends on it. This matters because exposure time is expensive. In the 2025 edition of the Cost of a Data Breach report, the average lifecycle to identify and contain a breach was 241 days, 17 fewer than the year before, and still close to eight months (IBM, news release of 30 July 2025).
Technical severity on its own is misleading. A critical CVE on a test server holding no sensitive data weighs less than a medium CVE on a system that processes personal data under the LGPD. Correlation provides that judgement by tying the flaw to its context. As we explain in 48,000 CVEs a year: where to start, the CVSS score measures the technical severity of a flaw, not the likelihood of exploitation or the impact on the business.
With assets, threats and controls in the same model, questions that used to take days of cross-referencing spreadsheets get a direct answer. Which critical assets are uncovered? Which failing control concentrates the most risk? Which supplier widens the attack surface? This connected view is the basis for tracking the right key risk indicators, instead of simply counting vulnerabilities.
Predictive models to anticipate exposure
Predictive models move risk analysis from the rear-view mirror to the windscreen by estimating where the next exposure is likely to appear. The urgency comes from the growth in volume: if the first nine months of 2026 have already overtaken the whole of 2025 in the NVD, waiting for an incident before acting does not scale.
Useful prediction is not guesswork. It combines vulnerability trends, the history of failing controls, signs of active exploitation, such as EPSS and the KEV catalogue, and asset criticality to estimate likelihood and impact. Instead of an endless list sorted by severity, the manager gets a short queue sorted by business risk.
This is where the human-in-the-loop model proves its worth. The AI suggests the prioritisation and shows the reasoning behind it. The analyst validates, adjusts and owns the decision. That traceability is what separates decision intelligence from a black box, a distinction we explore in Decision Intelligence Platform for Risk.
An important warning: automating analysis without governance creates new risk. In the 2025 edition of the Cost of a Data Breach report, 63% of breached organisations had no AI governance policy or were still developing one, and those with high levels of shadow AI, the use of AI without formal approval, saw on average US$670,000 more in breach costs (IBM, news release of 30 July 2025). The AI that analyses risk also has to be governed, the subject of our guide AI Governance Software: What It Is and How to Choose It.
Executive dashboards and data storytelling
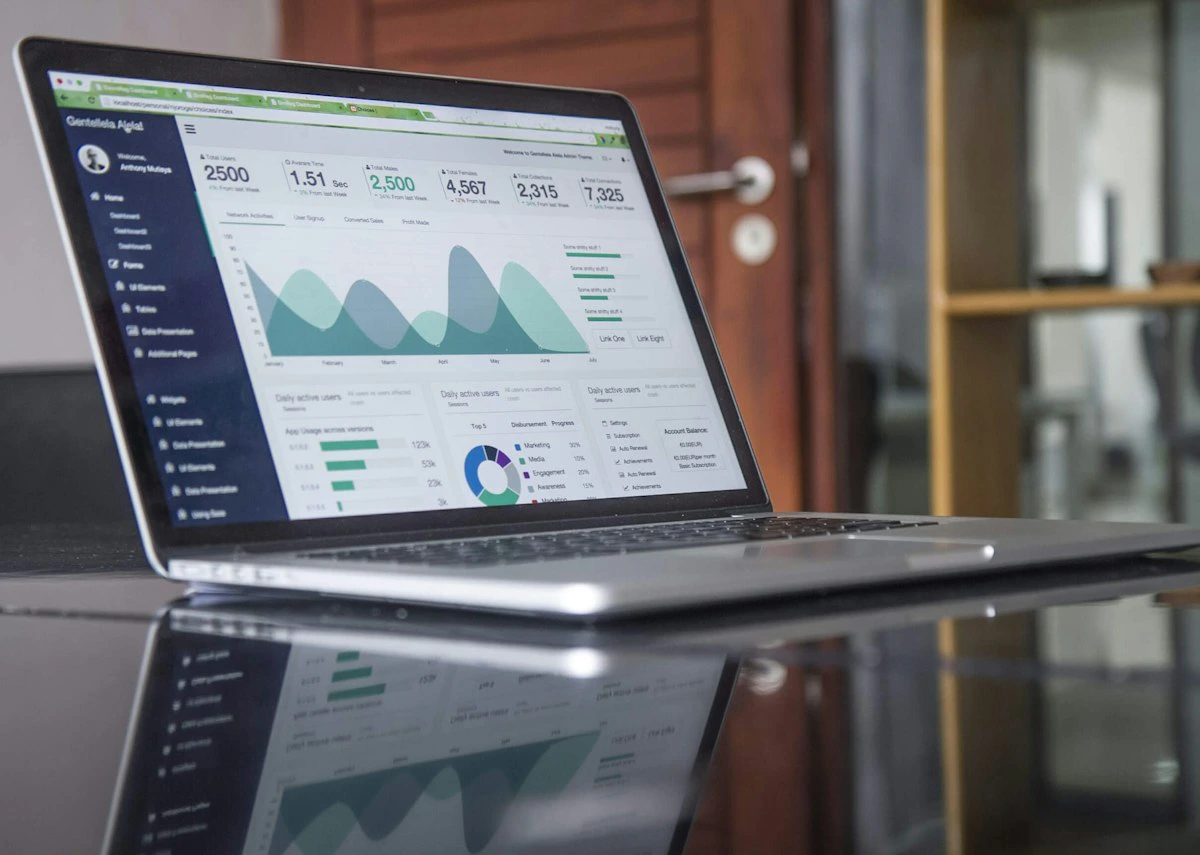
Executive dashboards translate technical risk into the language of decisions: financial impact, trend and priority. Without that translation, the board cannot decide. With it, the conversation moves from the number of CVEs to how much revenue is exposed and what changes if nothing is done. Talking in money requires estimating loss ranges, as our post on Cyber Risk Quantification (CRQ) shows.
Data storytelling works as a logical sequence. A good dashboard tells a story in three moves:
- Where we are: current exposure by business process and by framework.
- Where we are heading: the risk trend and the projected effect of controls under way.
- What to decide: the three actions with the greatest return in risk reduction.
That narrative has to be the same for the analyst and for the board member, only at different levels of detail. The analyst drills down to the specific CVE; the board sees the aggregate impact. Starting from the same source, without reconciling figures by hand before every meeting, is what gives the board confidence in the number in front of it.
Choosing an AI risk analytics platform
Choosing an AI risk analytics platform starts with one question: does it connect risk, controls and the business in a common source, or does it just stack up another dashboard? With the range of “AI-powered” tools growing, the quality of the choice matters more than the rush to adopt.
Use objective decision criteria:
- Common base: assets, threats, controls, suppliers and compliance in the same data model.
- A single control inventory, reused across the frameworks and obligations that apply to the organisation.
- Continuous correlation between vulnerability, asset, control and business process.
- Prioritisation by business impact, not just technical severity.
- Human-in-the-loop, with traceability for every recommendation and decision.
- Organisation of audit evidence, with a verifiable trail.
- Dashboards that translate risk into financial impact for the board.
Tools that promise fully automatic decisions, with no audit trail, transfer risk instead of reducing it. Before auditors and regulators, it is the organisation and its managers who answer for the decision, not the tool, and the platform has to show how it reached each recommendation.
Futture's Eagle was designed around these criteria, as an Enterprise Risk Intelligence platform: it integrates and contextualises data from technical tools, without replacing vulnerability scanners, and uses AI to suggest classifications, relationships and priorities. The user reviews, approves, rejects or adjusts each relevant result, and the aim is for every recommendation to keep its context, data origin, rationale and decision history (how AI works in Eagle). The practical next step is simple and worth doing this week: map your current risk data sources, identify where they disconnect and test a platform by asking it to correlate a single critical exposure from end to end, through to business impact. The tool that does this with traceability is the one that deserves to move forward.
Further reading: Decision Intelligence Platform for Risk, 48,000 CVEs a year: where to start and How the CISO should report cyber risk to the board.
Frequently asked questions
What is an AI risk analytics platform?
It is a system that brings asset, threat, control and compliance data into a common base and uses AI to correlate, prioritise and anticipate exposure. Instead of static reports, it provides an up-to-date view of enterprise risk, with traceable recommendations and decisions.
Does AI replace the risk analyst?
No. The final decision stays with the analyst or manager, in a human-in-the-loop model. AI speeds up data collection and correlation and suggests priorities, but the choice remains human. The trail of those decisions also helps demonstrate the measures taken, as required by the LGPD's principle of accountability (art. 6, X).
What data feeds AI risk analysis?
Asset inventory, vulnerability scanners, control results, supplier data, compliance records and external exposure signals. The more connected these sources are, the more accurate the correlation and the impact estimate become.
How does this data reach the board?
Through executive dashboards that translate technical risk into financial impact and trend over time. Data storytelling shows where exposure is growing, which decisions have been taken and the expected effect of each control.